The WindowsPerf team is excited to unveil the WindowsPerf GUI (Graphical User Interface) project, a Visual Studio 2022 extension designed to bring a seamless UI experience to WindowsPerf, the command-line performance profiling tool for Windows on Arm.
The project is a Linaro open-source initiative, It lives under the GitLab repo vs-extension.
What is WindowsPerf?
WindowsPerf is a (Linux perf inspired) lightweight Windows on Arm performance profiling tool. Profiling is based on ARM64 PMU (Performance Monitor Unit) and its hardware counters.
Why WindowsPerf GUI?
While WindowsPerf is a powerful tool, interacting with it through the command line can sometimes be daunting. The WindowsPerf GUI project aims to provide a more intuitive interface. We aimed to create a platform where developers can interact, tweak settings, and visualize WindowsPerf’s outputs without ever leaving the comfort of the IDE.
Current Features: Dive Deep into WindowsPerf GUI’s Capabilities
Bringing the command-line power of WindowsPerf into a GUI inside Visual Studio 2022 was no easy task, but we’ve made substantial progress. Let’s walk through what we’ve built so far:
Effortless WindowsPerf Configuration
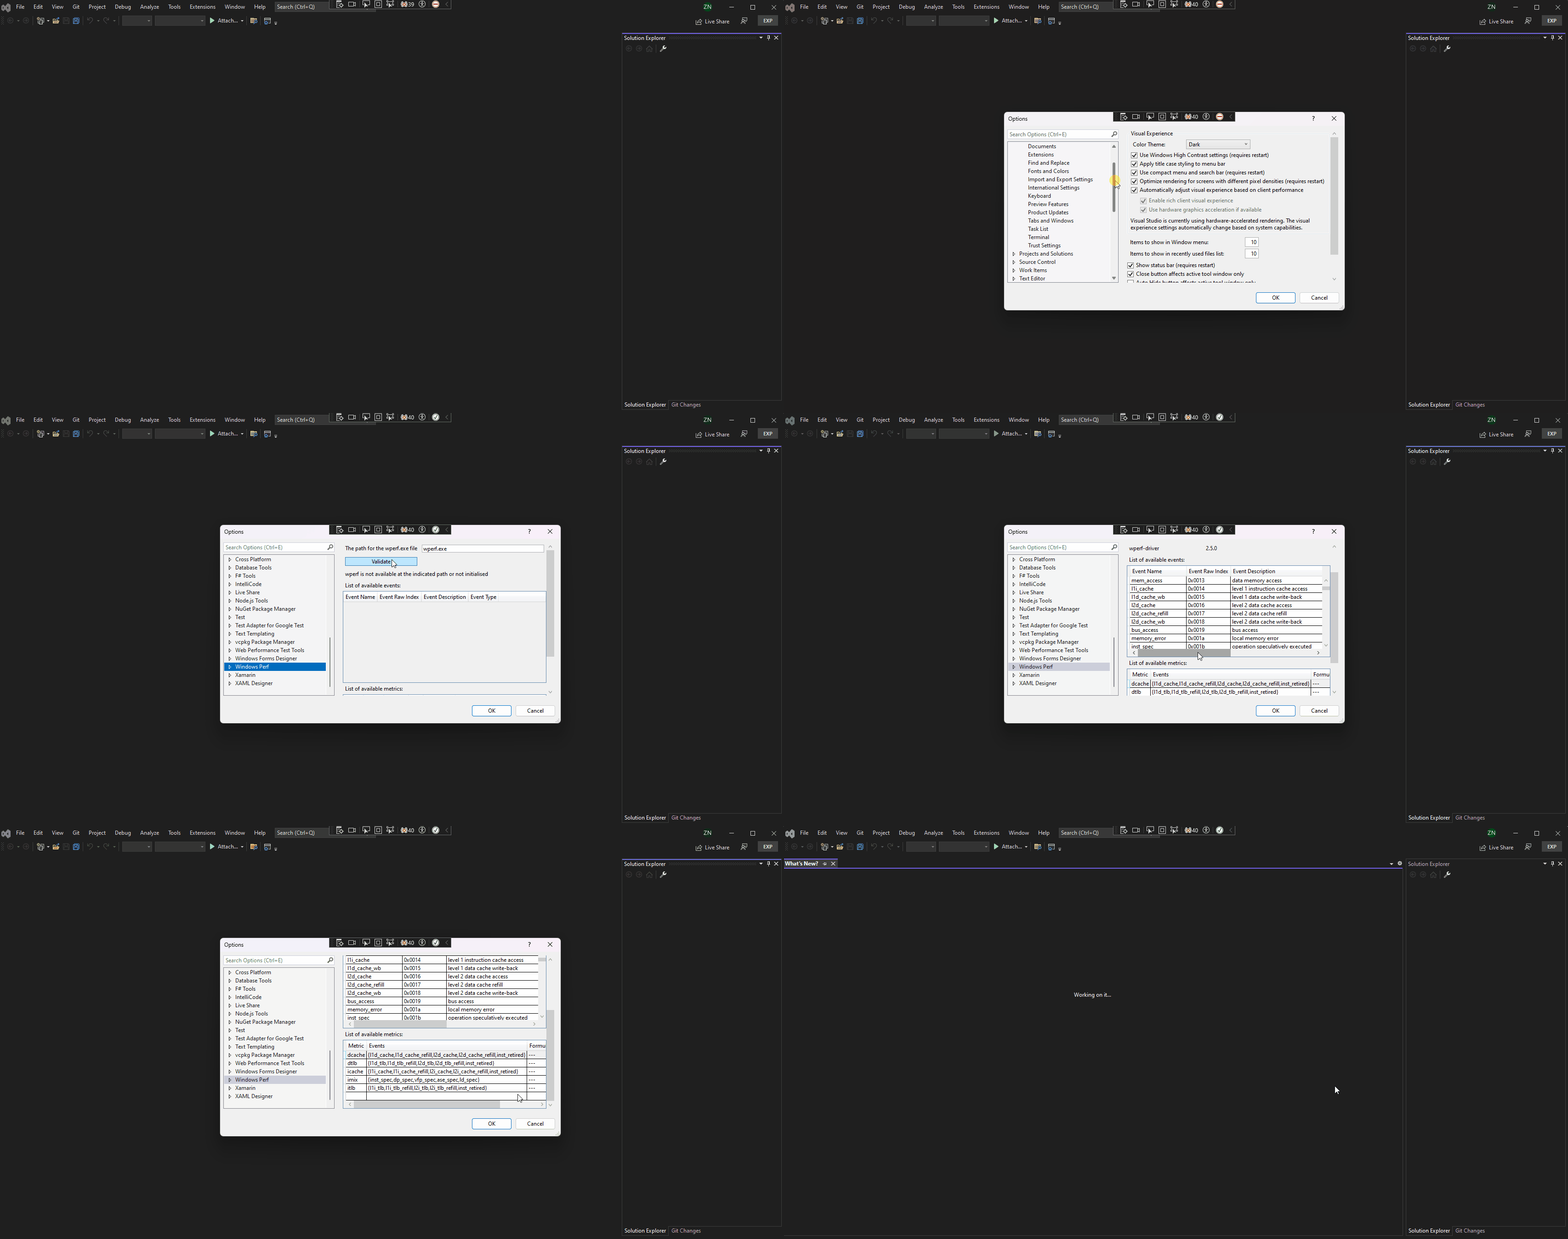
The heart of WindowsPerf GUI is its seamless connection to wperf.exe. Before diving into performance profiling, it’s pivotal to link the GUI to the executable. By navigating to Tools -> Options -> Windows Perf -> WindowsPerf Path, users can effortlessly integrate the executable into the extension’s environment.
Once the path is set, a simple click on the ‘Validate’ button will not only display the versions of wperf.exe and wperf-driver, but also populate available events and metrics in WindowsPerf.
An added safeguard? The extension remains dormant until this step is executed, ensuring you’re always on the right track. For a clearer understanding, have a look at the following illustration:

WindowsPerf settings UI tutorial
Gain Insights with Host Data
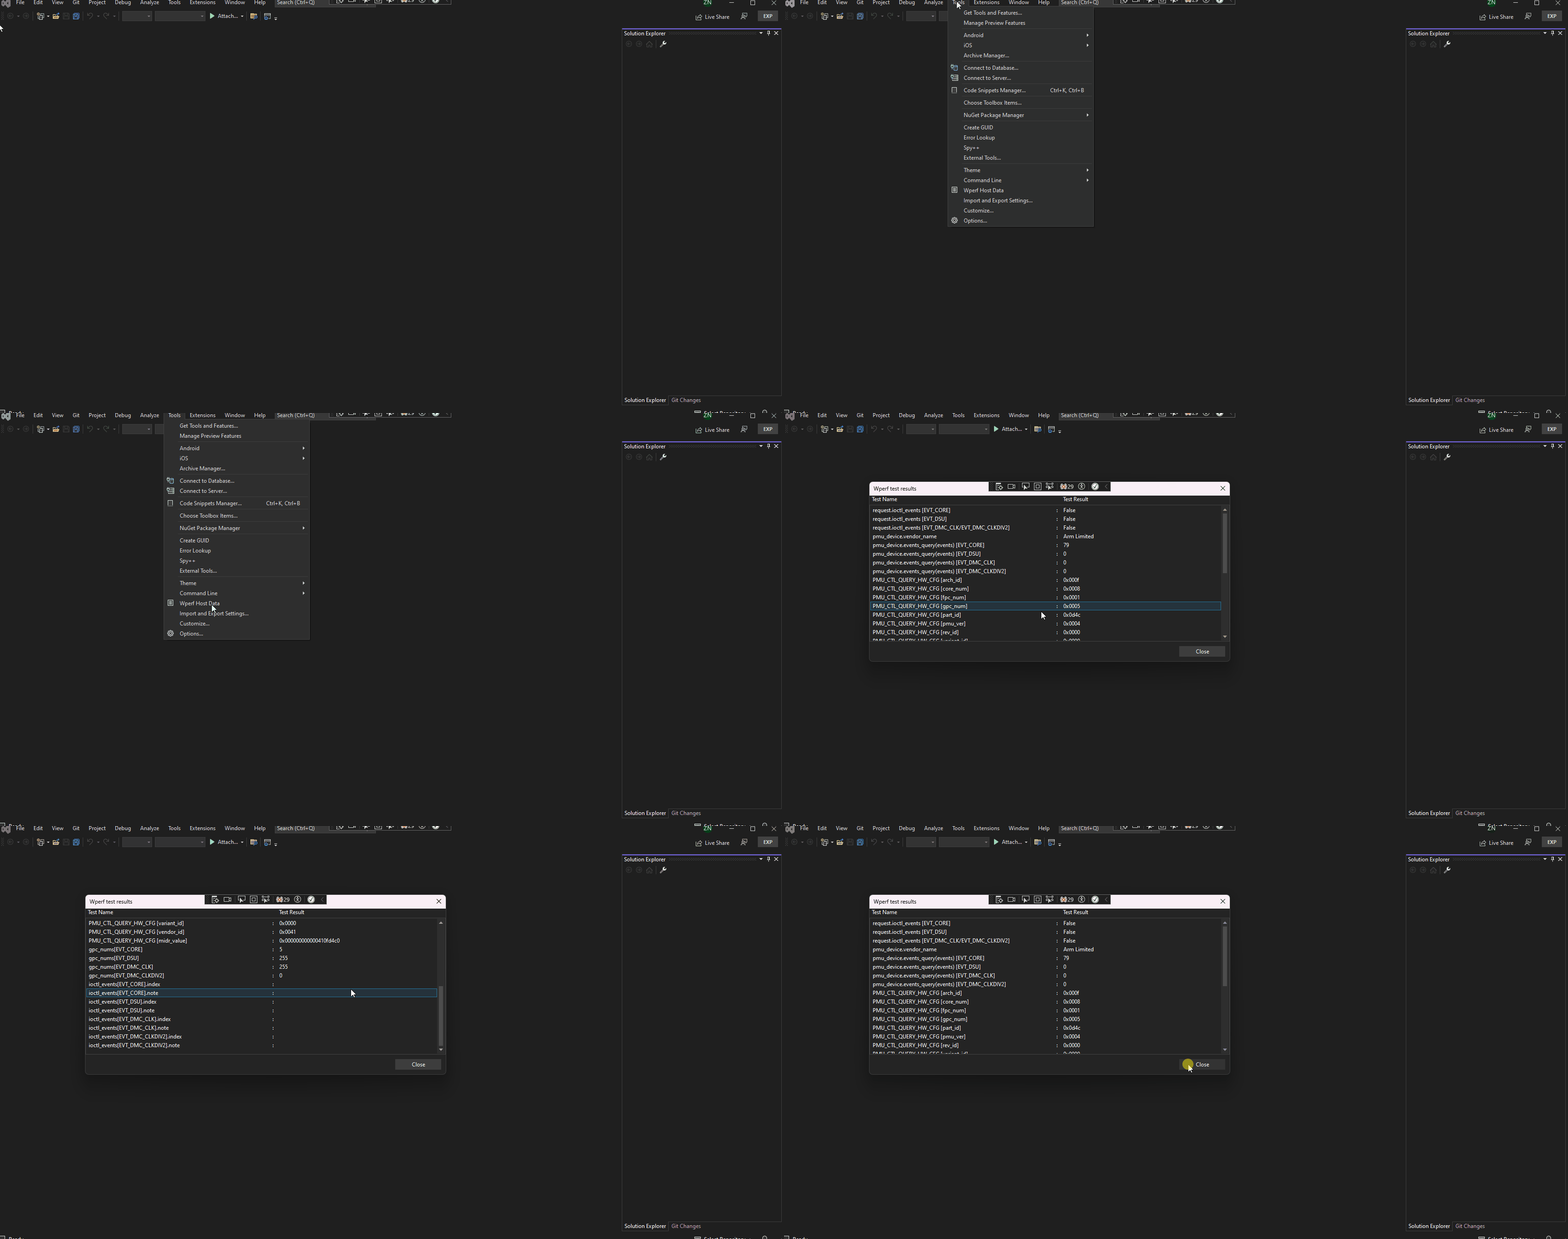
Beyond the primary profiling functionalities, we realized the importance of understanding the environment in which WindowsPerf operates. With the Tools -> WindowsPerf Host Data pathway, users can pull up a detailed window highlighting various tests executed by WindowsPerf and their corresponding results (the result of executing wperf test command). See this feature in action here:

WindowsPerf additional host data UI tutorial
Transparent and Detailed Outputs
Every developer knows the significance of transparent logs and outputs. We’ve ensured that all commands executed via the GUI, and their subsequent outputs, are meticulously logged.
To access this treasure trove of information, simply head to View -> Output and select WindowsPerf Output from the dropdown.
On the horizon: Sampling UI
Our next significant rollout will be the Sampling UI. This feature allows users to:
- Select events for sampling.
- Define the frequency and duration.
- Choose the program to be sampled.
Post-sampling, a UI will highlight the most active functions in varying shades, from green (least active) to red (most active). This immediate visual feedback lets developers click into these functions, diving into the source code and making optimizations where necessary.
Be a Part of Our Journey
WindowsPerf GUI is an open-source initiative, and its code can be accessed here. We warmly invite contributions and feedback. Your insights can shape the next big feature or refinement, enhancing the tool’s usability and impact.

